Associations between ambient temperature and risk of preterm birth in Sweden: A comparison of analytical approaches
Study description
This is a study of (de Bont et al. 2022) conducted in Sweden:
- 560,615 singleton births between 2014 and 2019
- 28,221 (5.1%) were born preterm, including 0.4%, 0.5%, and 4.2% borned extremely, very, and moderately preterm, respectively
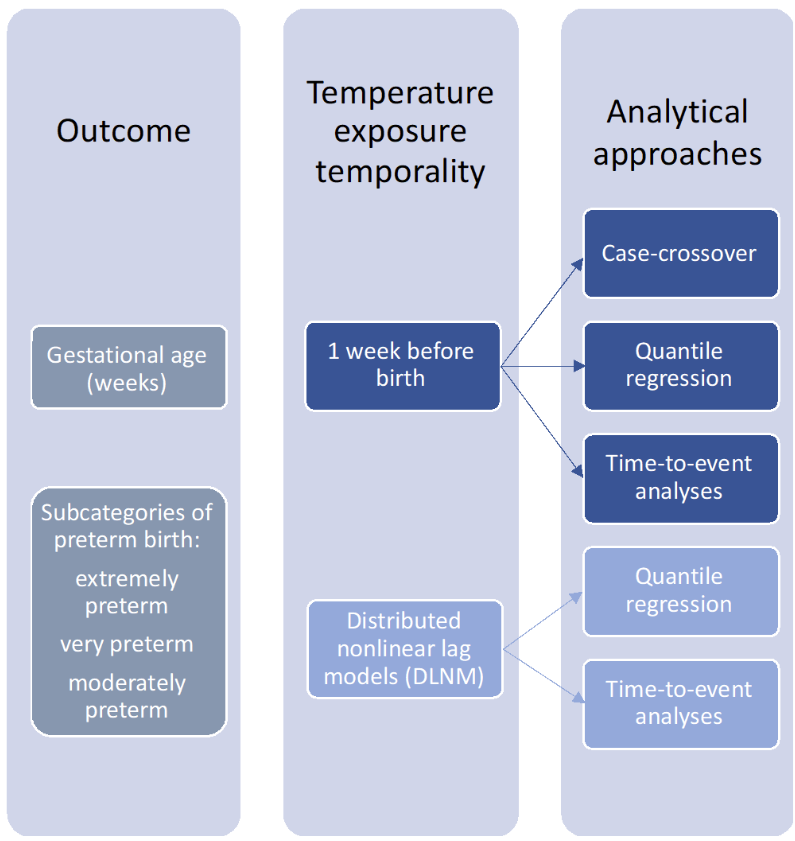
Outcome assessment: gestational age and preterm births
The main outcomes of the study are “continuous” gestational age (completed weeks) at birth and “binary” subcategories of preterm birth. Gestational age was captured from the Swedish SPR using a hierarchical definition for gestational age dating using date for embryo transfer, ultrasonography and/or date of last menstrual period. Early second-trimester ultrasonography for determining gestational age is performed in about 95% of all pregnant women in Sweden. Gestational age values ≤ 22 gestational weeks and >44 gestational weeks were excluded. Preterm birth was defined as birth before 37 completed weeks (WHO, 2018). Preterm births were categorized into extremely preterm birth (<28 weeks), very preterm birth (from 28 to 32 weeks), and moderately preterm birth (from 32 to 37 weeks) (WHO, 2020).
Exposure assessment: temperature
Daily mean air temperature with a spatial resolution 1-km2 was derived using satellite land surface temperature (LST), observed temperature data and spatiotemporal land use and land cover predictors.
| Empty Cell | Extremely pretermN = 1924 (0.34%) | Very pretermN = 2636 (0.47%) | Moderately pretermN = 23,664 (4.22%) | No pretermN = 532,519 (94.97%) | P.trend |
|---|---|---|---|---|---|
| Sex | <0.001 | ||||
| Male | 53.5% | 55.6% | 53.9% | 51.4% | |
| Female | 46.5% | 44.4% | 46.1% | 48.6% | |
| Birth type | <0.001 | ||||
| Caesarean | 0.8% | 2.4% | 4.9% | 7.6% | |
| Induced | 18.2% | 8.4% | 18.5% | 18.2% | |
| Spontaneous | 81.0% | 89.2% | 76.6% | 74.2% | |
| Period of birth | <0.001 | ||||
| December–February | 23.9% | 25.9% | 24.5% | 22.6% | |
| March–May | 27.2% | 25.4% | 25.4% | 26.1% | |
| June–August | 24.4% | 25.2% | 26.4% | 26.9% | |
| September–November | 24.5% | 23.5% | 23.8% | 24.4% | |
| Geographic location | 0.010 | ||||
| North | 11.1% | 8.8% | 9.9% | 9.5% | |
| Central | 34.7% | 37.4% | 37.6% | 39.0% | |
| South | 54.2% | 53.8% | 52.5% | 51.5% | |
| Maternal age (years old) | 0.516 | ||||
| ≤24 | 13.4% | 14.1% | 13.4% | 11.7% | |
| 25–29 | 28.6% | 29.5% | 31.0% | 31.6% | |
| 30–34 | 30.1% | 30.8% | 31.7% | 34.5% | |
| ≥35 | 27.9% | 25.5% | 23.9% | 22.1% | |
| Missing | 0.1% | 0.0% | <0.1% | <0.1% | |
| Maternal education | <0.001 | ||||
| 1–9 years | 8.4% | 8.5% | 7.3% | 7.2% | |
| 10–12 years | 30.8% | 33.0% | 34.0% | 31.8% | |
| >12 years | 30.7% | 36.0% | 39.5% | 43.8% | |
| Missing | 30.1% | 22.5% | 19.2% | 17.3% | |
| BMI categories | <0.001 | ||||
| Underweight | 1.7% | 2.4% | 3.1% | 2.4% | |
| Normalweight | 35.1% | 44.6% | 48.1% | 53.4% | |
| Overweight | 20.6% | 22.7% | 24.3% | 24.3% | |
| Obesity | 16.1% | 15.4% | 15.7% | 13.1% | |
| Missing | 26.6% | 14.9% | 8.8% | 6.8% | |
| Smoking pregnancy | <0.001 | ||||
| Yes | 5.6% | 6.1% | 6.3% | 4.2% | |
| No | 64.4% | 75.5% | 80.5% | 84.5% | |
| Missing | 30.0% | 18.5% | 13.2% | 11.3% | |
| Hypertension | <0.001 | ||||
| Yes | 1.7% | 1.9% | 1.2% | 0.4% | |
| No | 78.5% | 88.4% | 93.8% | 96.4% | |
| Missing | 19.8% | 9.7% | 5.0% | 3.1% | |
| Diabetes mellitus | <0.001 | ||||
| Yes | 1.4% | 2.4% | 3.8% | 0.7% | |
| No | 79.4% | 88.1% | 91.4% | 96.3% | |
| Missing | 19.2% | 9.6% | 4.8% | 3.0% |
Statistical consideration
| Description | Case-crossover design | Quantile regression | Time-to-event |
|---|---|---|---|
| Population size | Includes only cases in the analyses | Total population | Foetuses at risk |
| Outcome format | Dichotomous (extremely preterm, very preterm, moderately preterm, all preterm births) | Gestational age in weeks | Dichotomous (extremely preterm, very preterm, moderately preterm, all preterm) and time of follow-up |
| Contrast of inference | Temporal contrasts within individuals | Spatiotemporal contrast in exposures within and across individuals | Spatiotemporal contrast in exposures and time of event |
| Confounding | Each case serves as its own control, improving adjustment for observed and unobserved individual-level confounders | Requires information and adjustment for confounders | Requires information and adjustment for confounders |
| Statistical method | Conditional logistic regressions | Quantile regression | Cox proportional hazards models |
| Can you apply distributed nonlinear lag models? | No (not in our study design) | Yes | Yes |
In all three approaches, ambient temperature was considered during the week before birth (lag 0–6 days) as referent exposure. The shape of the relationship between ambient temperatures and preterm birth was modelled with natural splines with two inner knots. From the curves, risks were extrapolated comparing temperatures above the 90th, 95th or 99th percentiles versus the 50th percentile of municipality-specific exposure distribution.
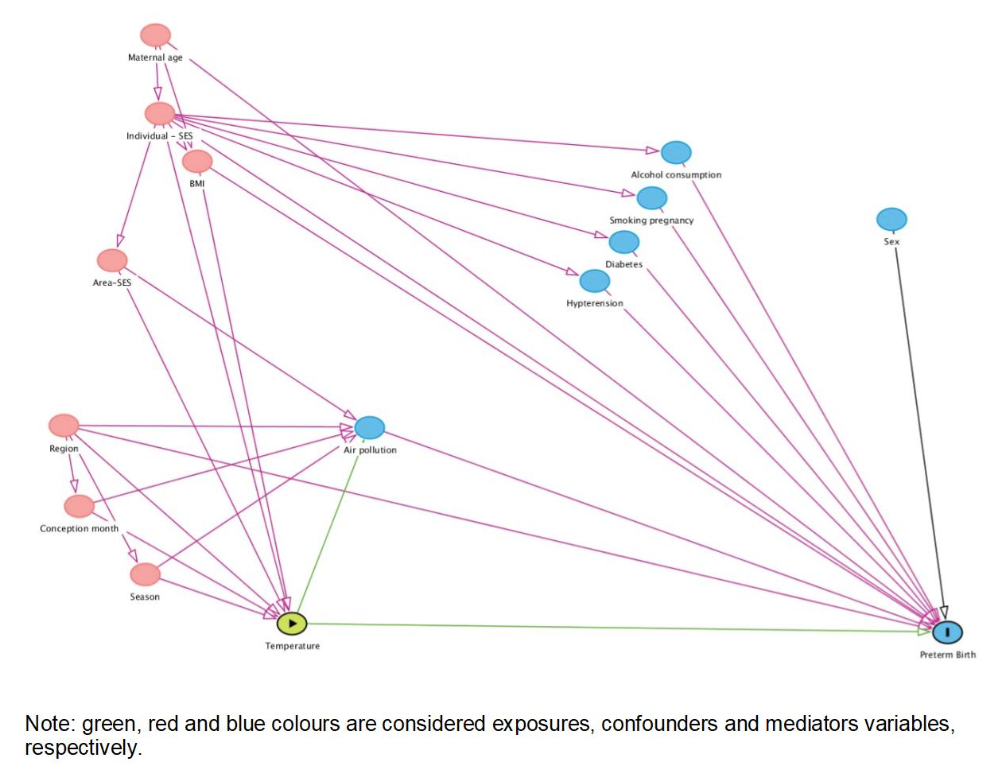
For quantile regression and time-to-event analysis only, the covariates were selected using directed acyclic graph. This included month and year of conception, region, BMI, maternal education, and maternal age. In the quantile regression and time-to-event analysis, a distributed lag nonlinear model (DLNM) was applied to identify potential windows of vulnerability during the entire pregnancy.
Case-crossover design
Case-crossover design has been extensively applied in the literature to investigate associations between short-term exposures to environmental determinants and health outcomes. The key strength of the design is that each case serves as its own control, which implies perfect adjustment for observed or unobserved individual-level confounders that do not vary, or vary slowly, over time, such as age, smoking habits and socio-economic deprivation. The main limitation of the case-crossover, and the time-stratified approach for control selection, is that only short lags are allowed in the analyses, preventing applying DLNM models to investigate longer-term windows of susceptibility to ambient temperature. Longer lags should be used cautiously as cases and control windows could overlap leading to a form of overmatching. This would lead to drop of power and increase selection bias as the control exposure will not be conditionally independent of the matched case exposure
Time-to-event
In the time-to-event approach, the hazard of preterm births was modelled in relation to ambient temperature exposure and considered gestational age as the time axis. The analysis was repeated for each preterm category and the time of follow-up was estimated as follows:
- extremely preterm birth, from gestational week 22 until week 28;
- very preterm birth, from week 28 until week 32; (exclude babies born before week 28)
- moderately preterm births from week 32 until 37;
- all preterm births from week 22 until week 37.
All the observations at the lower bound of each time interval were left-censored, and the non-cases at the end of each time-period were right-censored. In each analysis, only the population at risk and the relevant lags of exposure were included. For instance, for the very preterm births, only the populations with births above 28 weeks (excluding the extremely preterm births) were included, and 32 weekly lags were included for the DLNM. Then, the Cox proportional hazard regressions was applied to estimate the associations between temperature and each preterm birth category.